Charts
Charts creation is a feature of Dynamics 365 that makes it easier to display a view of your system. Charts must be associated with an entity in the environment and can be used in your dashboards.
Understanding Charts
Membri consists of several entities. Some of these entities are probably more familiar to you (accounts, contacts, invoices, events, etc.), but Membri is composed of many other entities that enable the functioning of your environment (renewals, invoice products, event types, etc.). You can browse these entities using the global search bar in your environment.
Charts are associated with an entity. In general, the most complex step in creating a chart is choosing the right entity to create the chart on.
Your environment also consists of system views as well as customized views for records of your entities. Chart display uses data from a record view of an entity. Therefore, entities and views are closely linked to the final display of a chart. To learn more about creating views in your environment, check out our section on custom views.
Creating a Chart
Accessing the Chart Creation Area
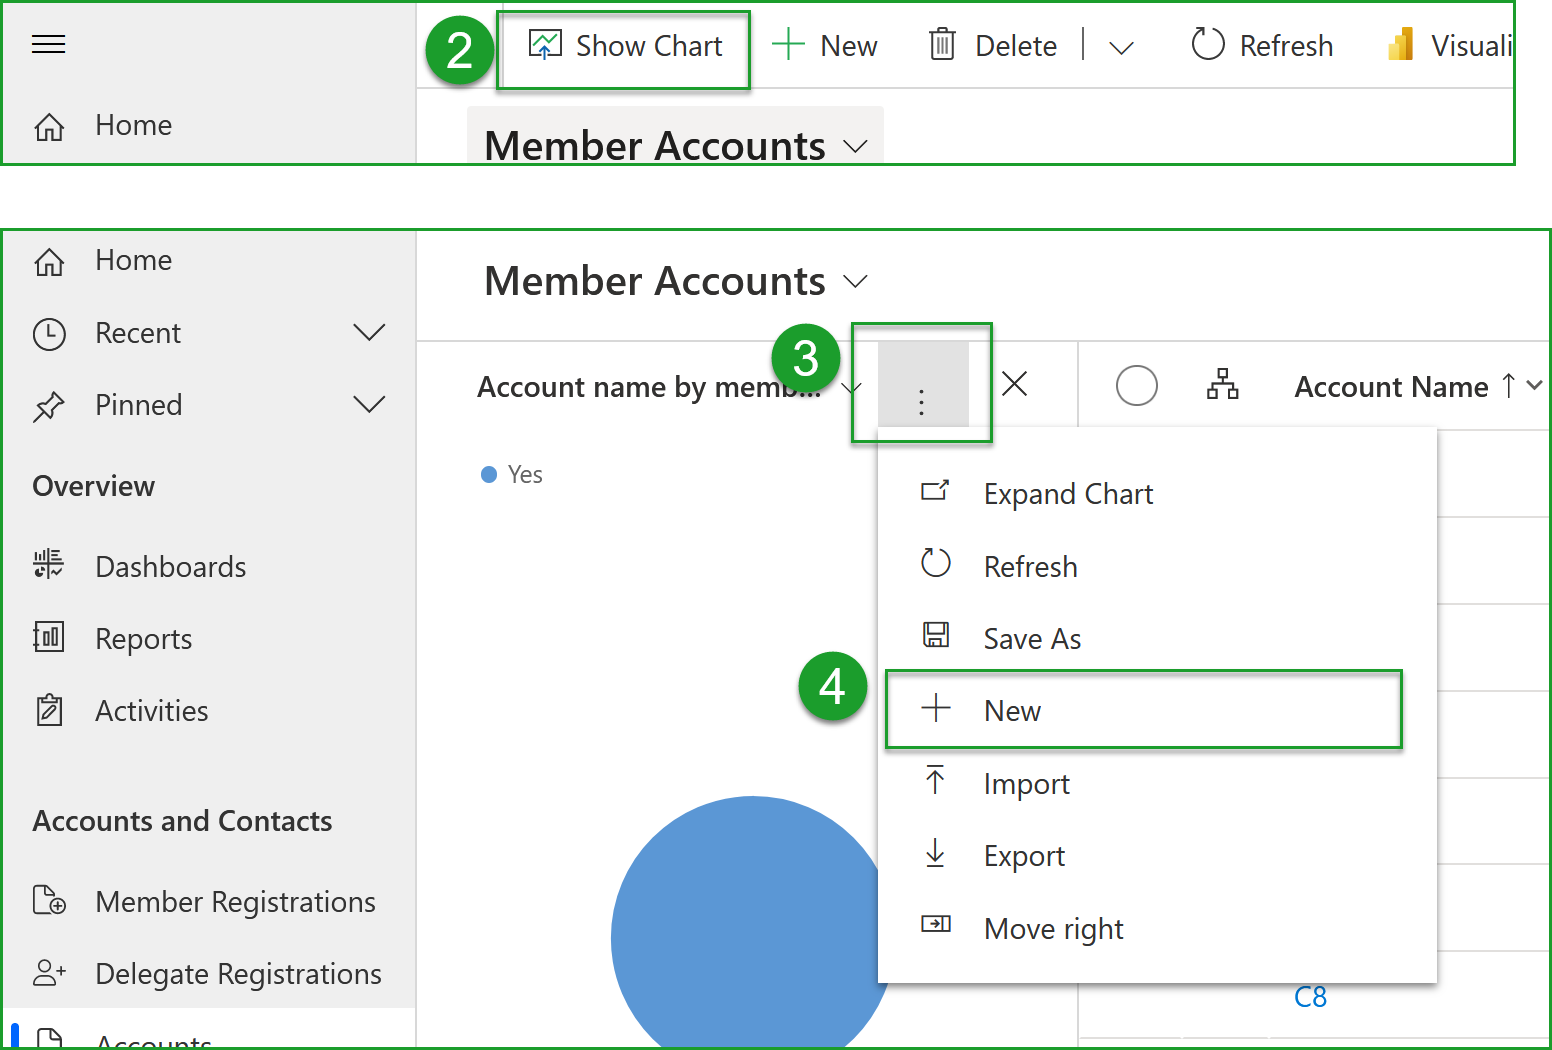
- Access the entity for which you want to create a chart;
- Select the
Show Chartbutton; - Select the three small dots on the chart;
- From the dropdown, select the
+ Newbutton;
You will then be directed to the old Dynamics 365 environment for chart creation.
Defining Chart Parameters
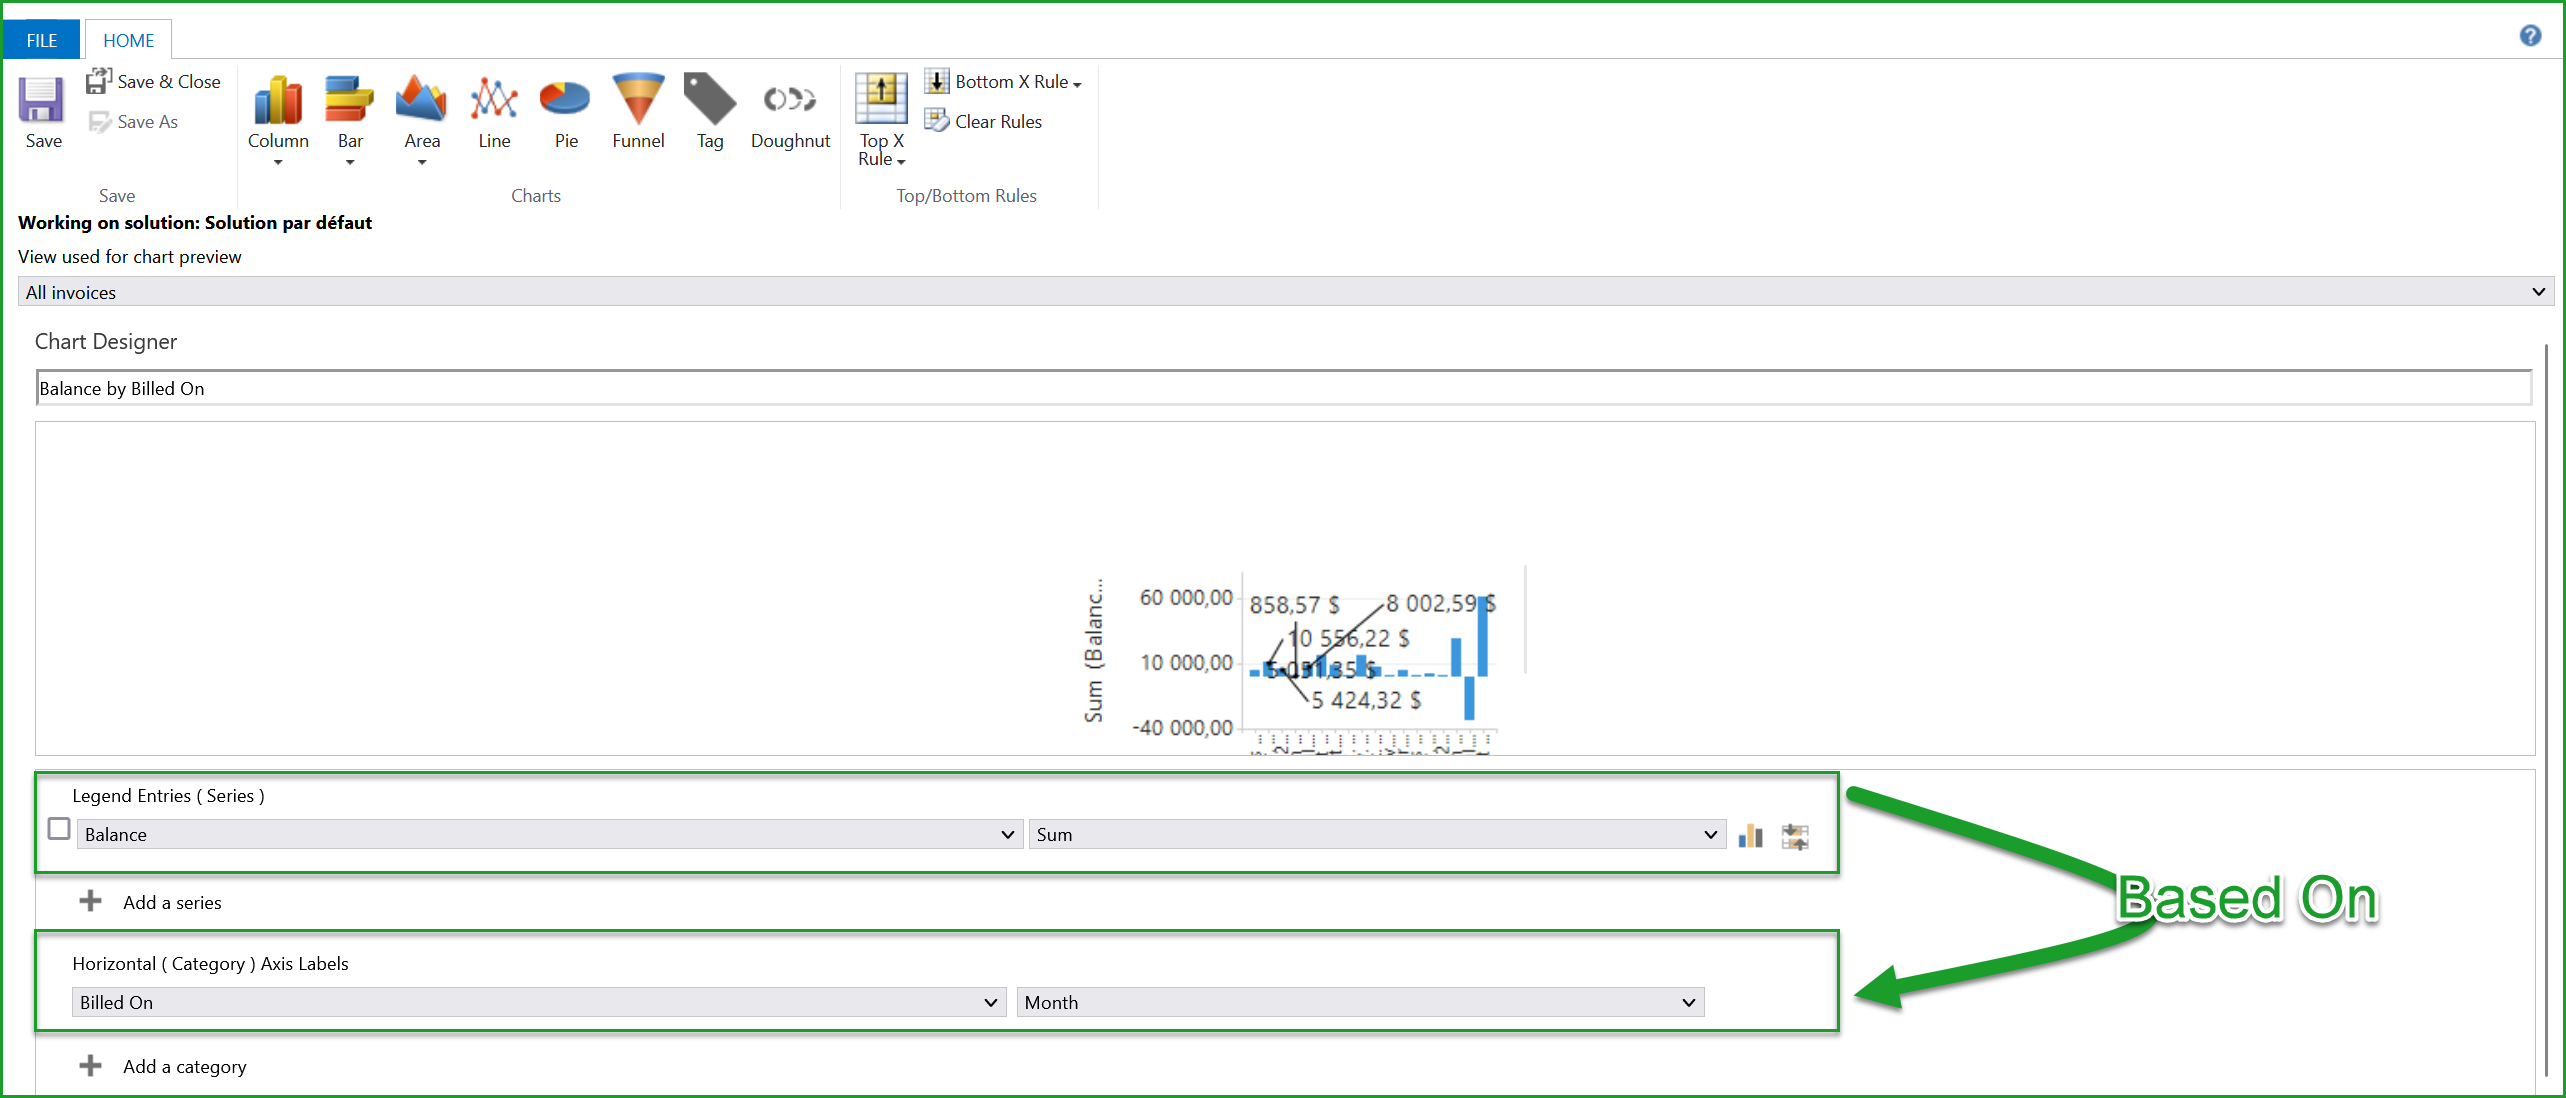
To properly define your axes, it is necessary to consider what you want to achieve based on what. You will need to add what you want to obtain in the Legend (Series) section based on the other parameter that should be added in the Horizontal (Category) section.
- I am creating a chart for the entity of invoices;
- I want to obtain the sum of all my balances based on the billing month;
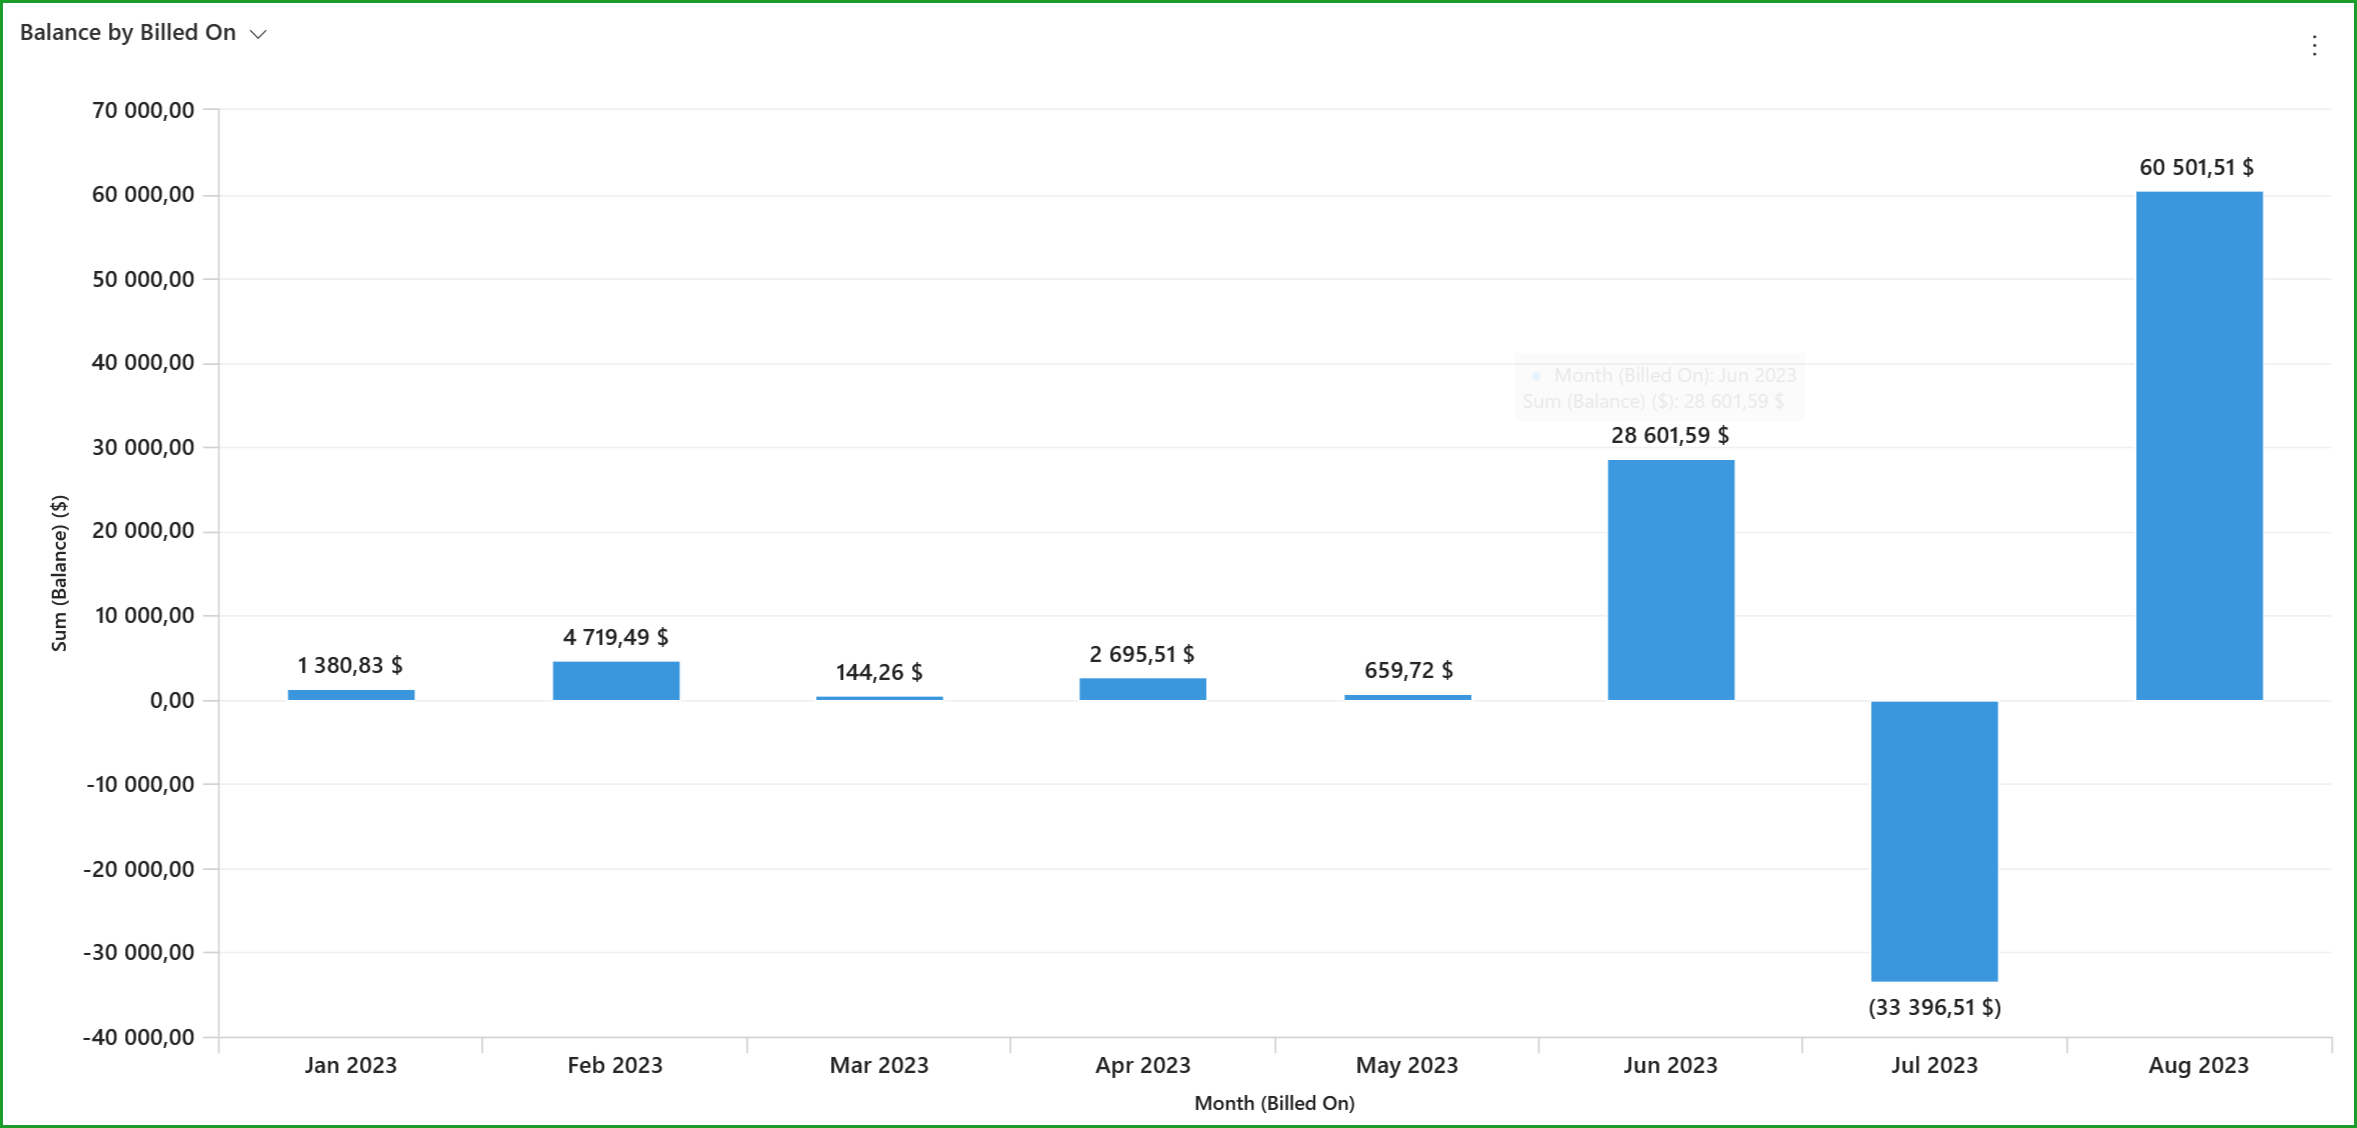
- I save the chart;
- I choose a view to display only invoices for the current year;
Result:
Still unsure? Contact us - support@vendere.ca